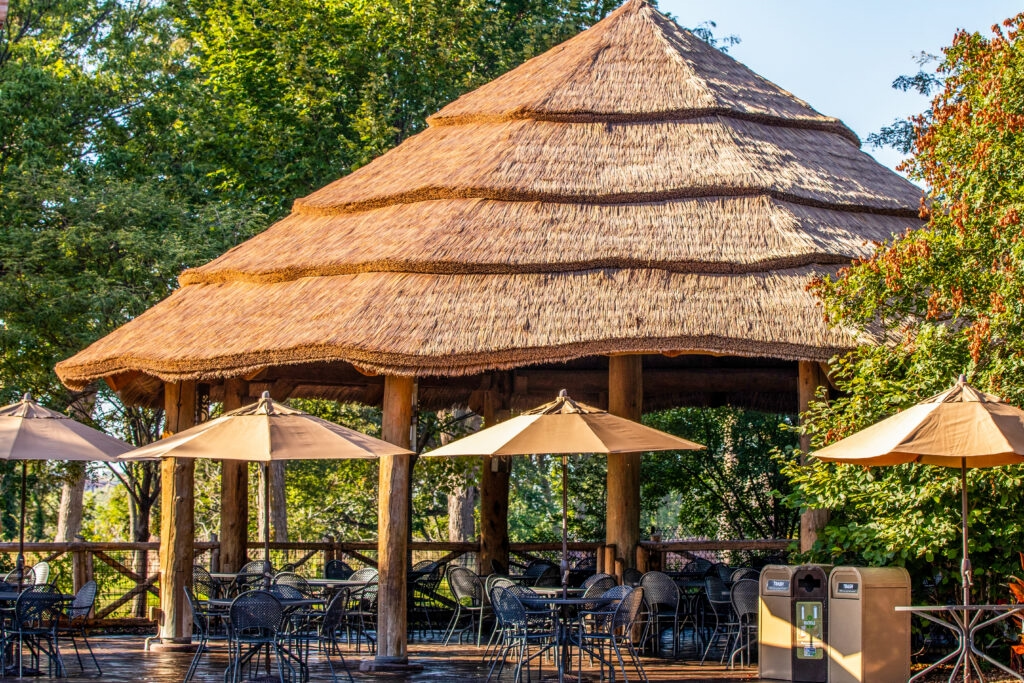
Today, for a variety of reasons, less than 0.1 percent of houses in Ireland have thatched roofs. Pretty much everyone understands that between building codes, insurance requirements and modern demands for pest-free living, natural thatch is not a convenient roofing option. Back in the 1800’s, as many as half of all Irish people lived beneath thatched roofs. And they sure were beautiful.
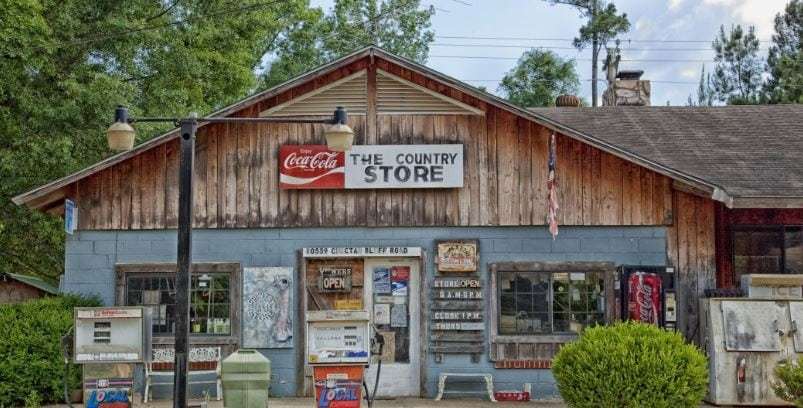
Is the roof of your commercial building showing signs the asphalt shingles are failing? If so, it might be time to start shopping for a new roof for your business property. U.S. roofing industry sales are growing substantially and the United States needs more roofers to keep up with the high demand for roofing repair and new roofs. Consequently, many roofing contractors are booked out on their schedules. So, it’s important to know if your asphalt shingles are failing before it’s too late.
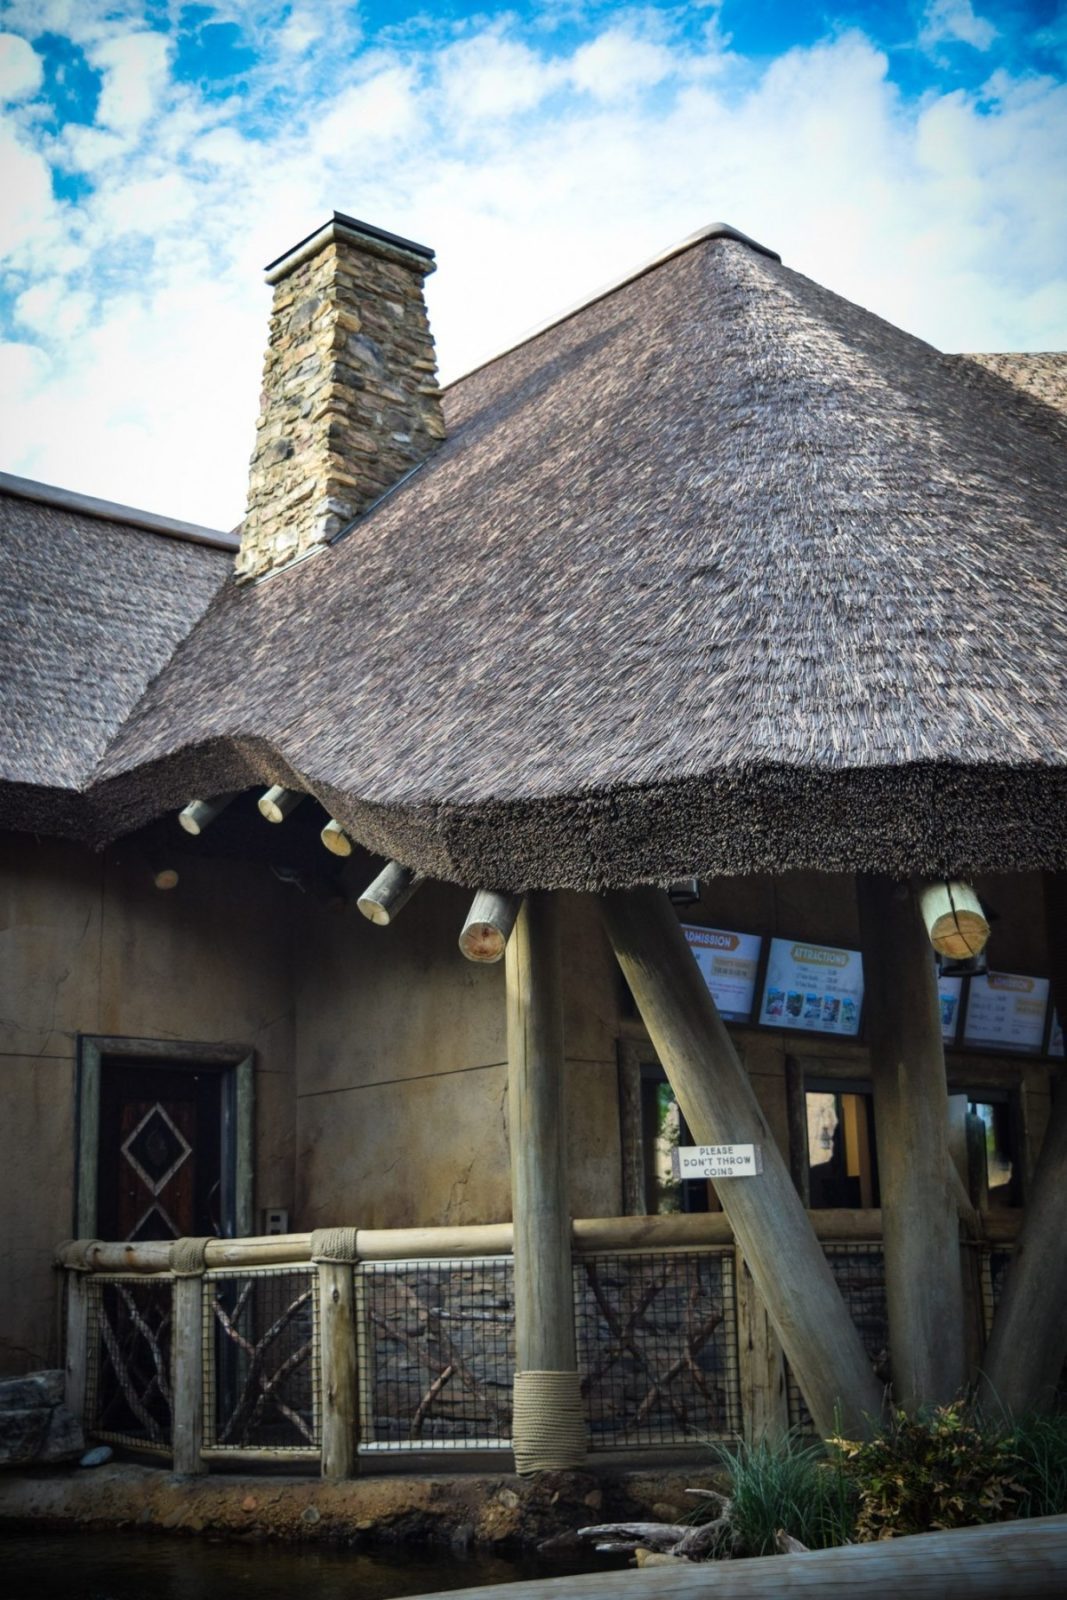
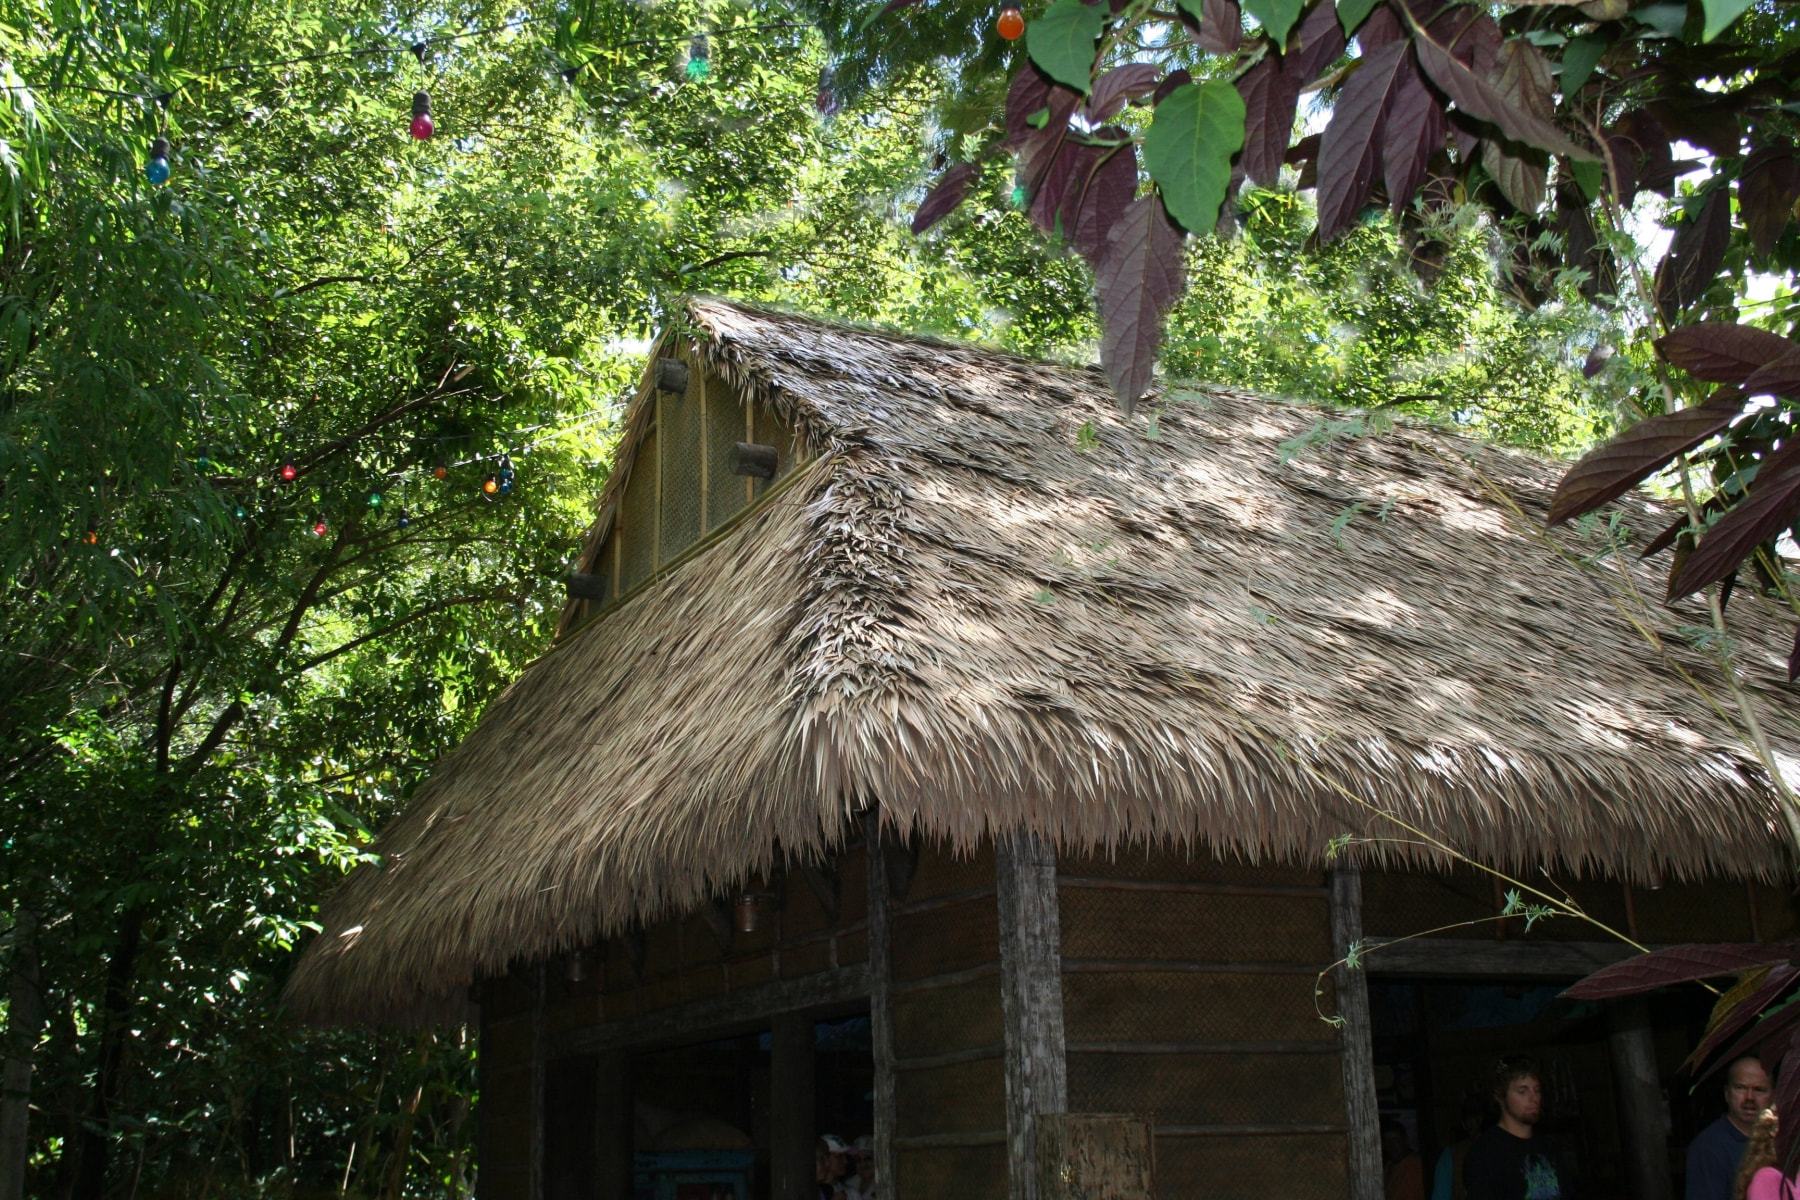
Have you ever heard of a thatched roof beetle? Actually, many species of beetles infest thatched roofs around the world. For example, in the Guano-Palm thatched roofs, it’s not uncommon for tiny 4 mm-long beetles to makes homes in thatched roofs and then just fall down inside the home. People will tell stories of beetles falling from thatched roofs before afternoon rains. In many areas around the world, people just accept this. In areas where buildings are insured and must pass inspections, the only option is regular maintenance and ample pesticides. If you want a natural thatched roof, that’s just how it is.
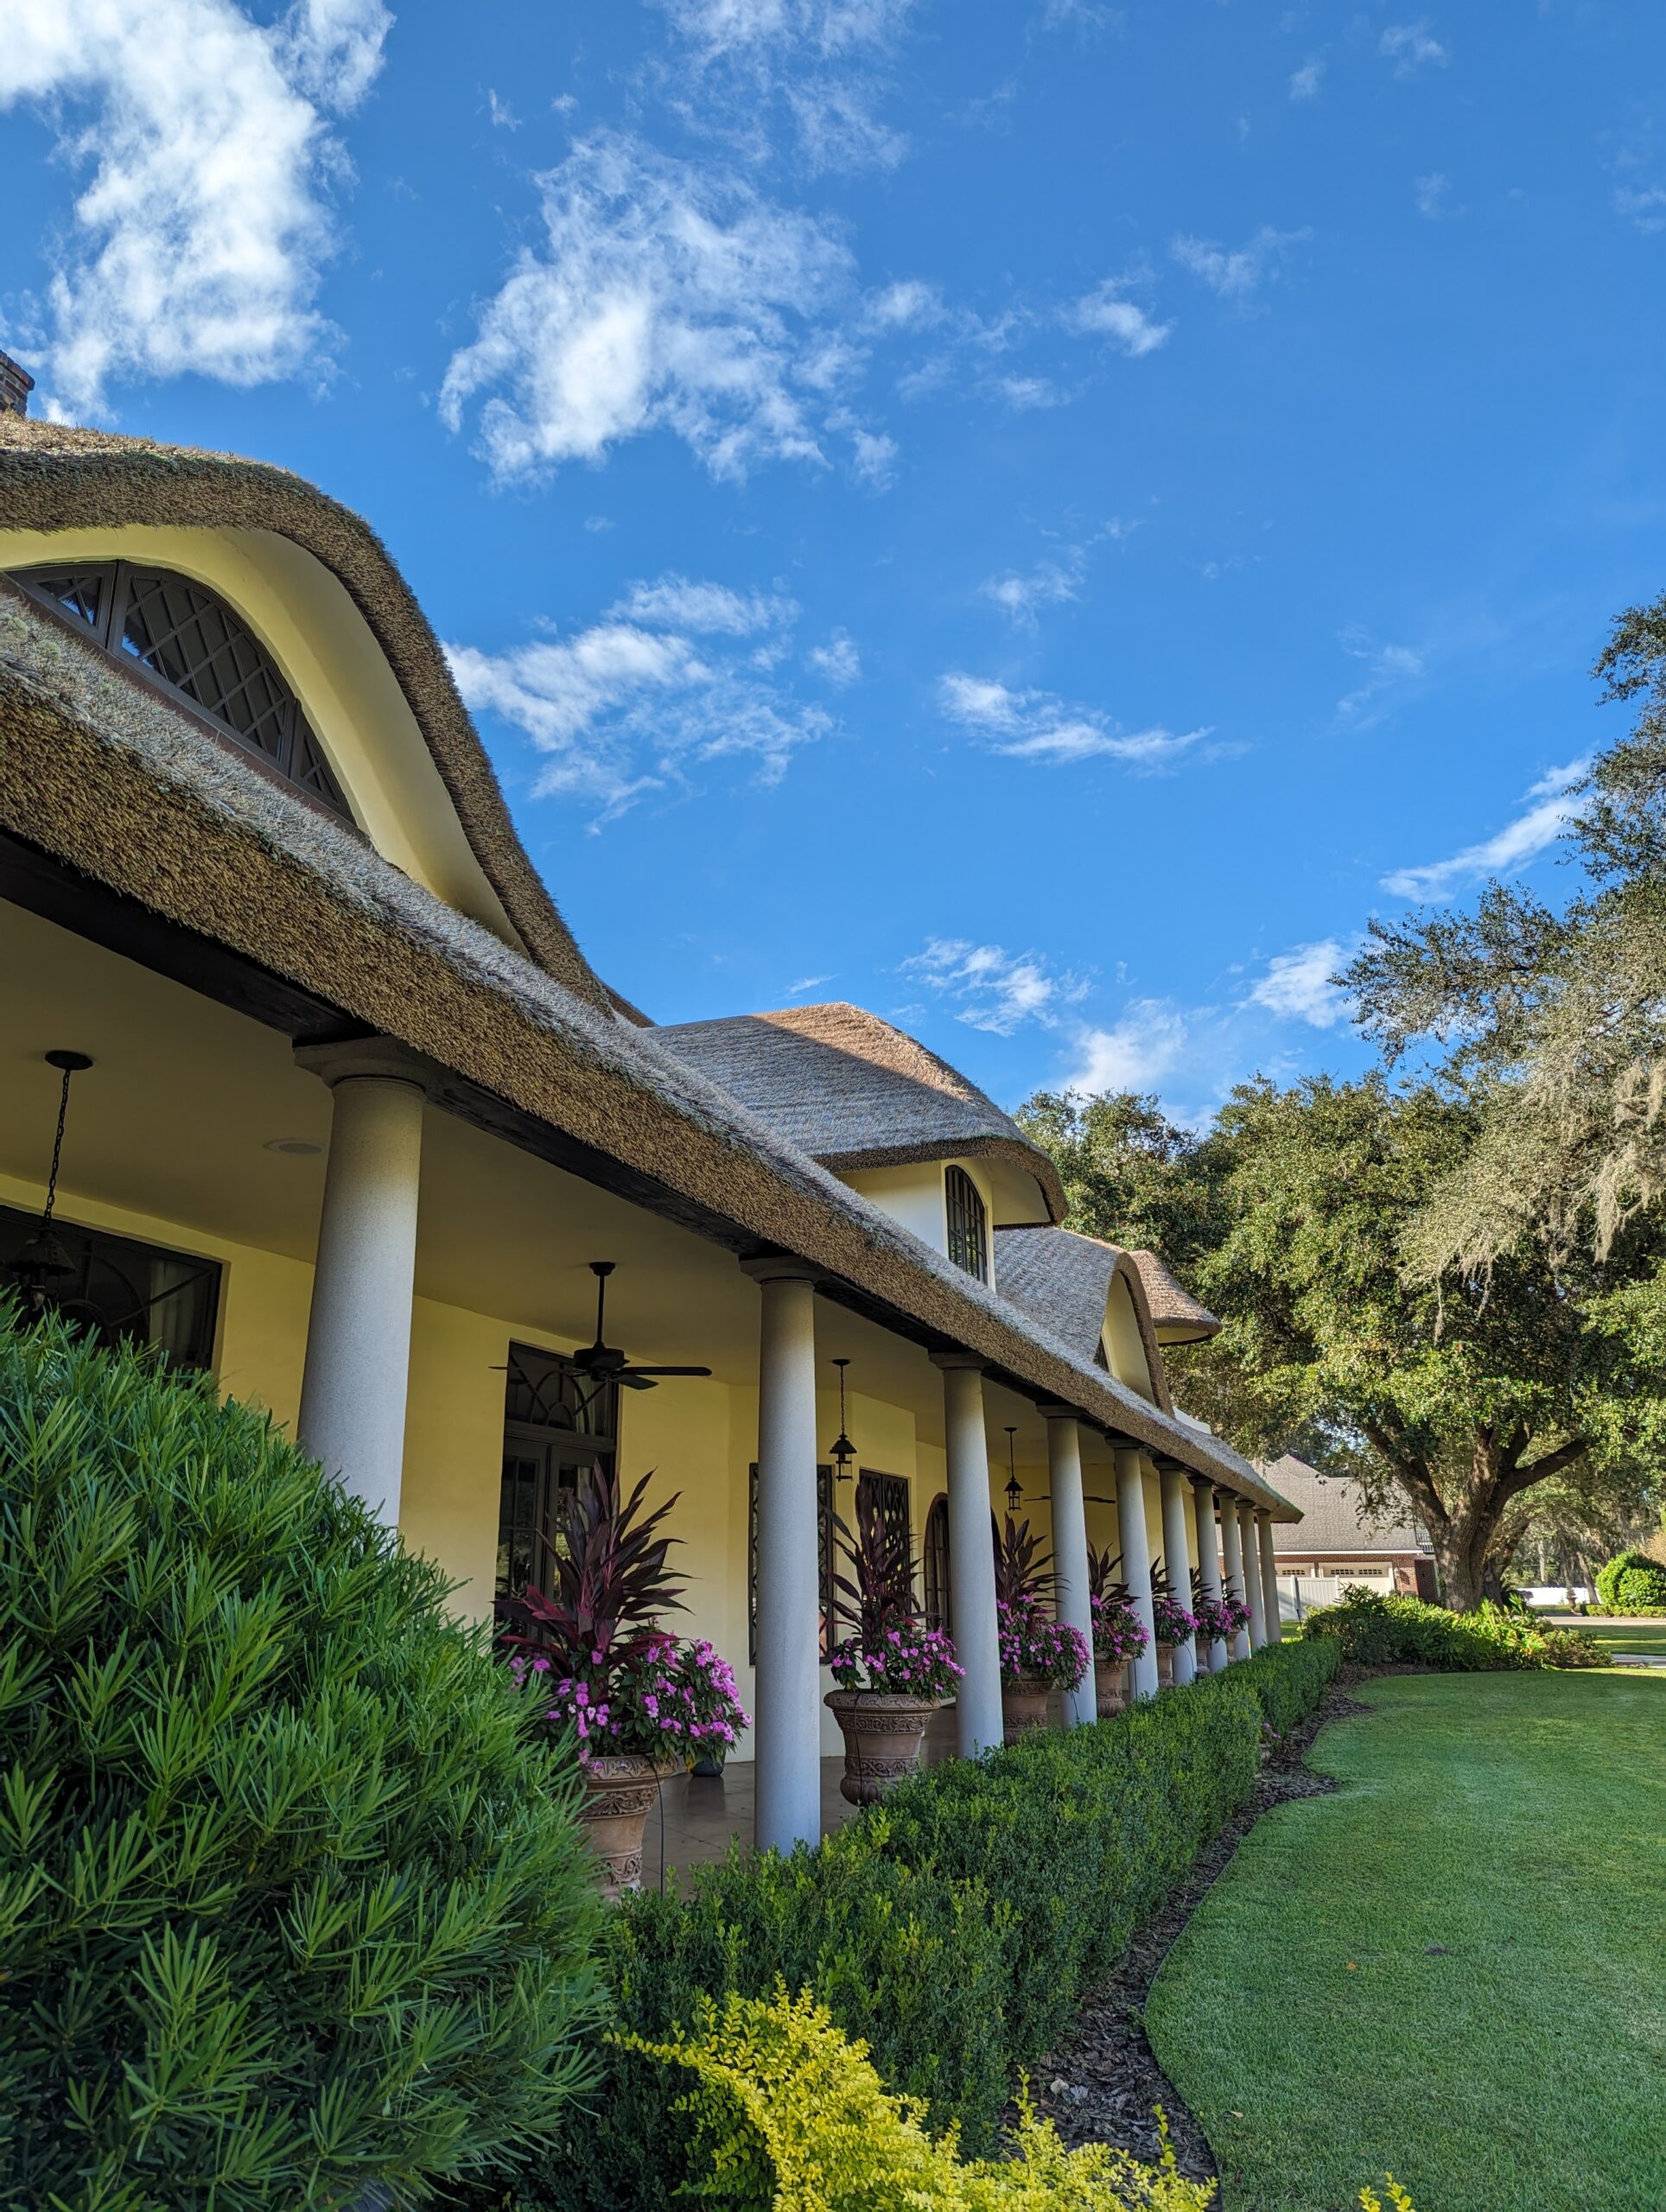
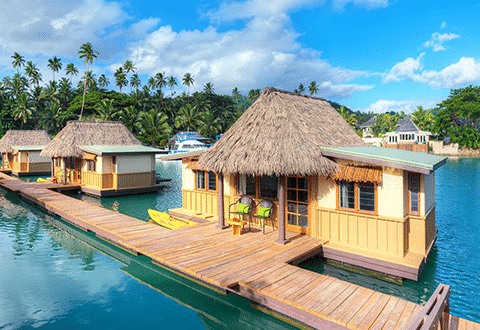
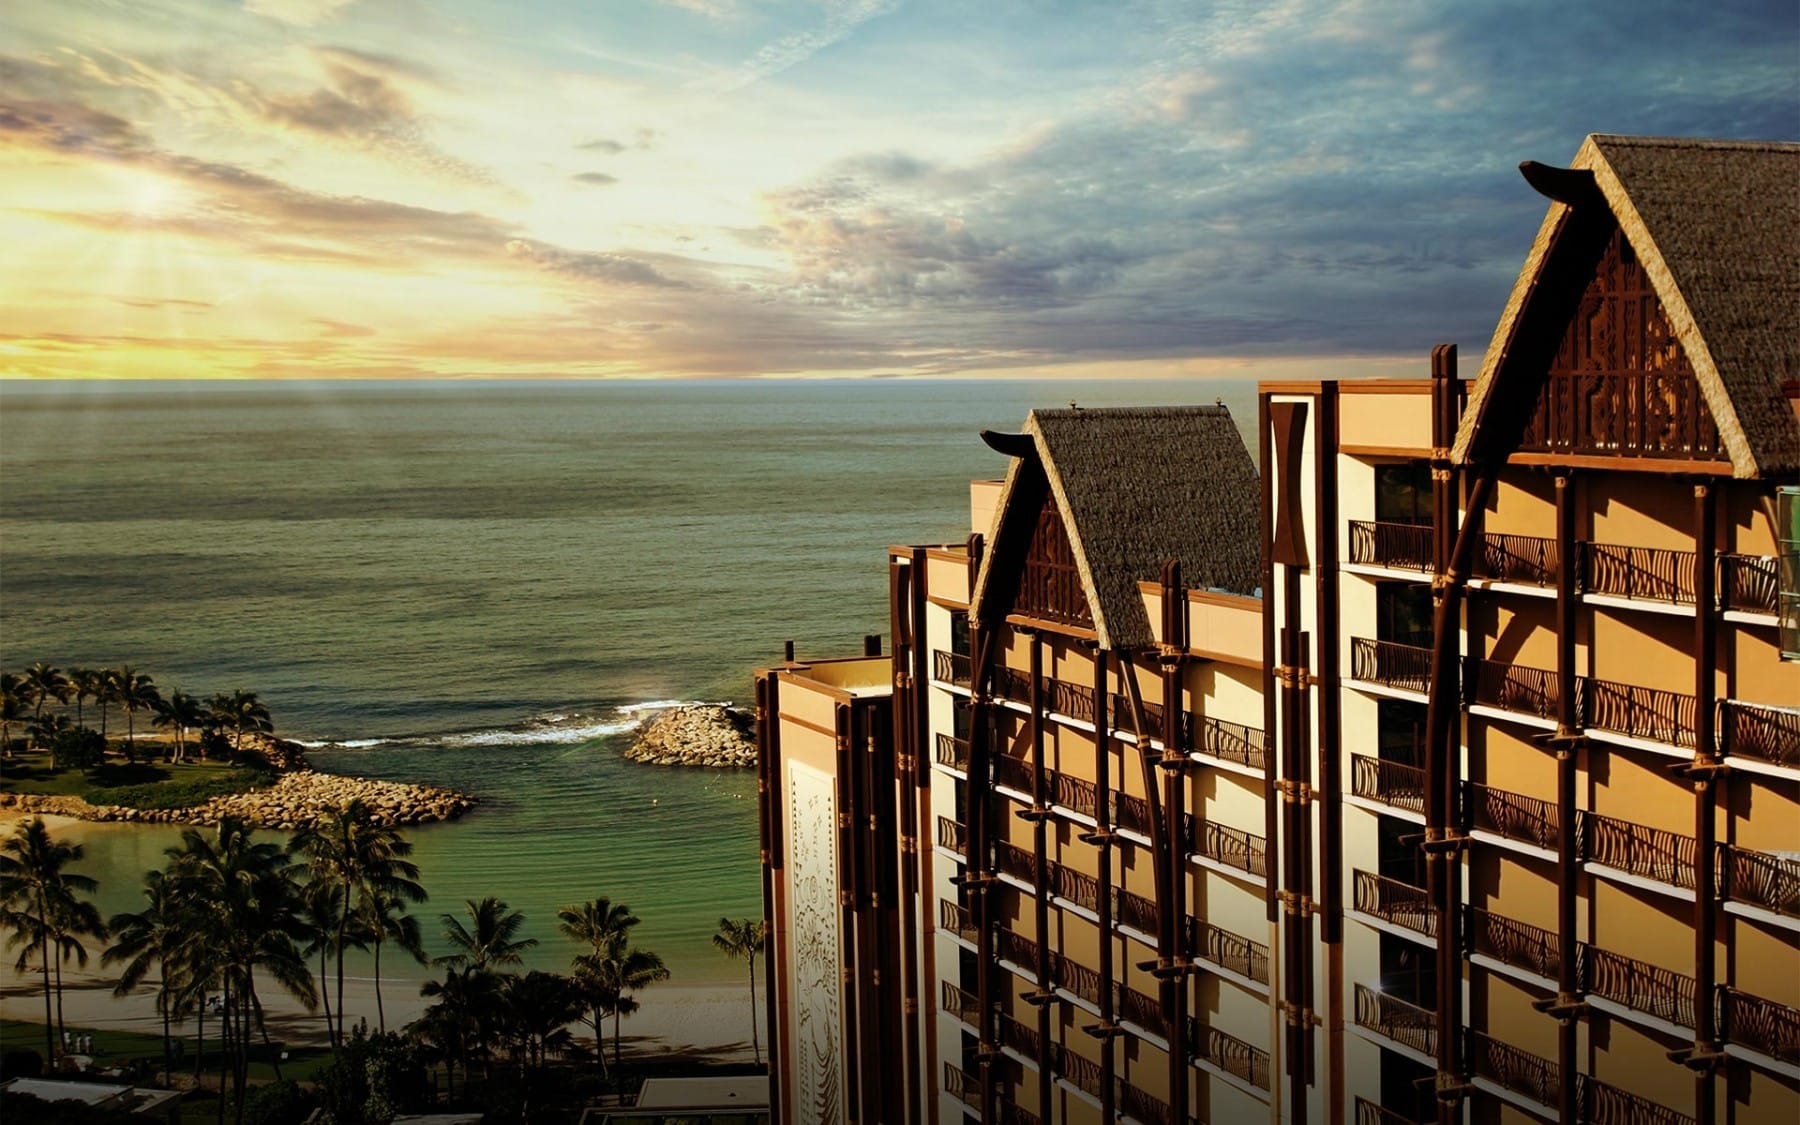
Endureed applied years of advanced roofing and world class artistry to create the first product that would be given the “Endureed” badge. Our products quickly became well-known. They appeared on the roof tops of world-renown resorts, hotels and amusement parks. Their realism astounded people. These business owners, managers and contractors quickly integrated our products. It was clear that our products were durable, due to intense product testing. Ability to withstand even hurricane-force winds and UV damage and lack of maintenance made our products incredibly popular. Even homeowners tried our products.
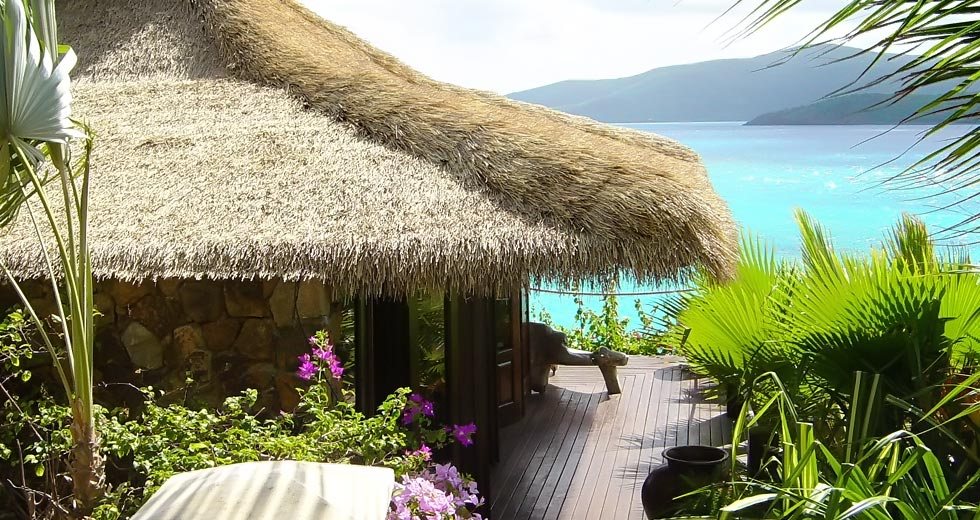
Let’s face it, achieving a pest-free thatched roof has always been nearly impossible. Even when measures to avoid pests like pesticides and netting were employed, a pest-free thatched roof was barely attainable. Now, thanks to new technology, homeowners, resort owners and business owners have a legitimate option for a pest-free thatched roof.
Many people give up their dream of owning a thatched roof, because natural thatched roofs come with insurance hassles. Insurance companies charge extra premiums for natural thatched roofs. Why? Natural thatched roofs often come with heightened repair costs, fire risks an other incidental issues. Sometimes, insurance companies require electrical systems to get inspected every three years or so by an contractor. Some even require regular roof inspections. If these roof inspections uncover problems, insurers usually require immediate repairs.